매트랩 기초 subplot, plot 을 이용해 그래프 그리기
카테고리 없음2020. 3. 24. 16:39
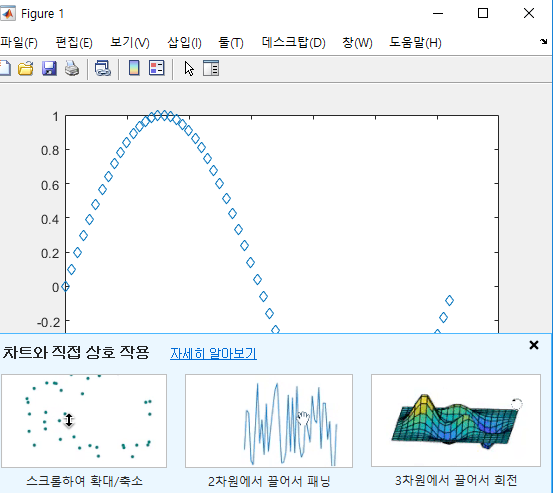
>> plot(t,sit(t),'d')
다야몬드 형태로 그려보겠다.
t는 x축 sit(t)는 y축
xlabel("Values of t")
x축에 명칭 입력

>> ylabel('Sine')
%y축 명명

>> title('Sine Function')

plot(t,cos(t),'rx-')

axis([0 2*pi -1.5 1.5])
x 축 0에서 2*pi 까지 그린다
y축은 -1.5에서 1.5까지

axis tight
딱 맞춤
subplot(2,1,1)
행렬 2X1에 1번째꺼
subplot(2,1,2)
행렬 2X1에 2번째꺼
close all
그래프창을 닫는다.
>> plot(t,sin(t),'d')
>> xlabel("Values of t")
>> ylabel('Sine')
>> title('Sine Function')
>> plot(t,cos(t),'rx-')
>> axis([0 2*pi -1.5 1.5])
>> subplot(2,1,1)
>> plot(t,sin(t))
>> subplot(3,2,2)
>> subplot(3,2,5)
>> subplot(3,2,4)
>> subplot(3,2,5)
>> plot(t,sin(t)); axis tight

plot(t,cos(t),'r'); axis tight

